Tech Life as Graphs
As a geek I often imagine situations in life as a math equations and graphs (don’t you all do it too? What’s wrong with you people?!). In this post I’ll try to describe some situations is the tech life as graphs:
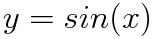
How excited are you when working in corporate:
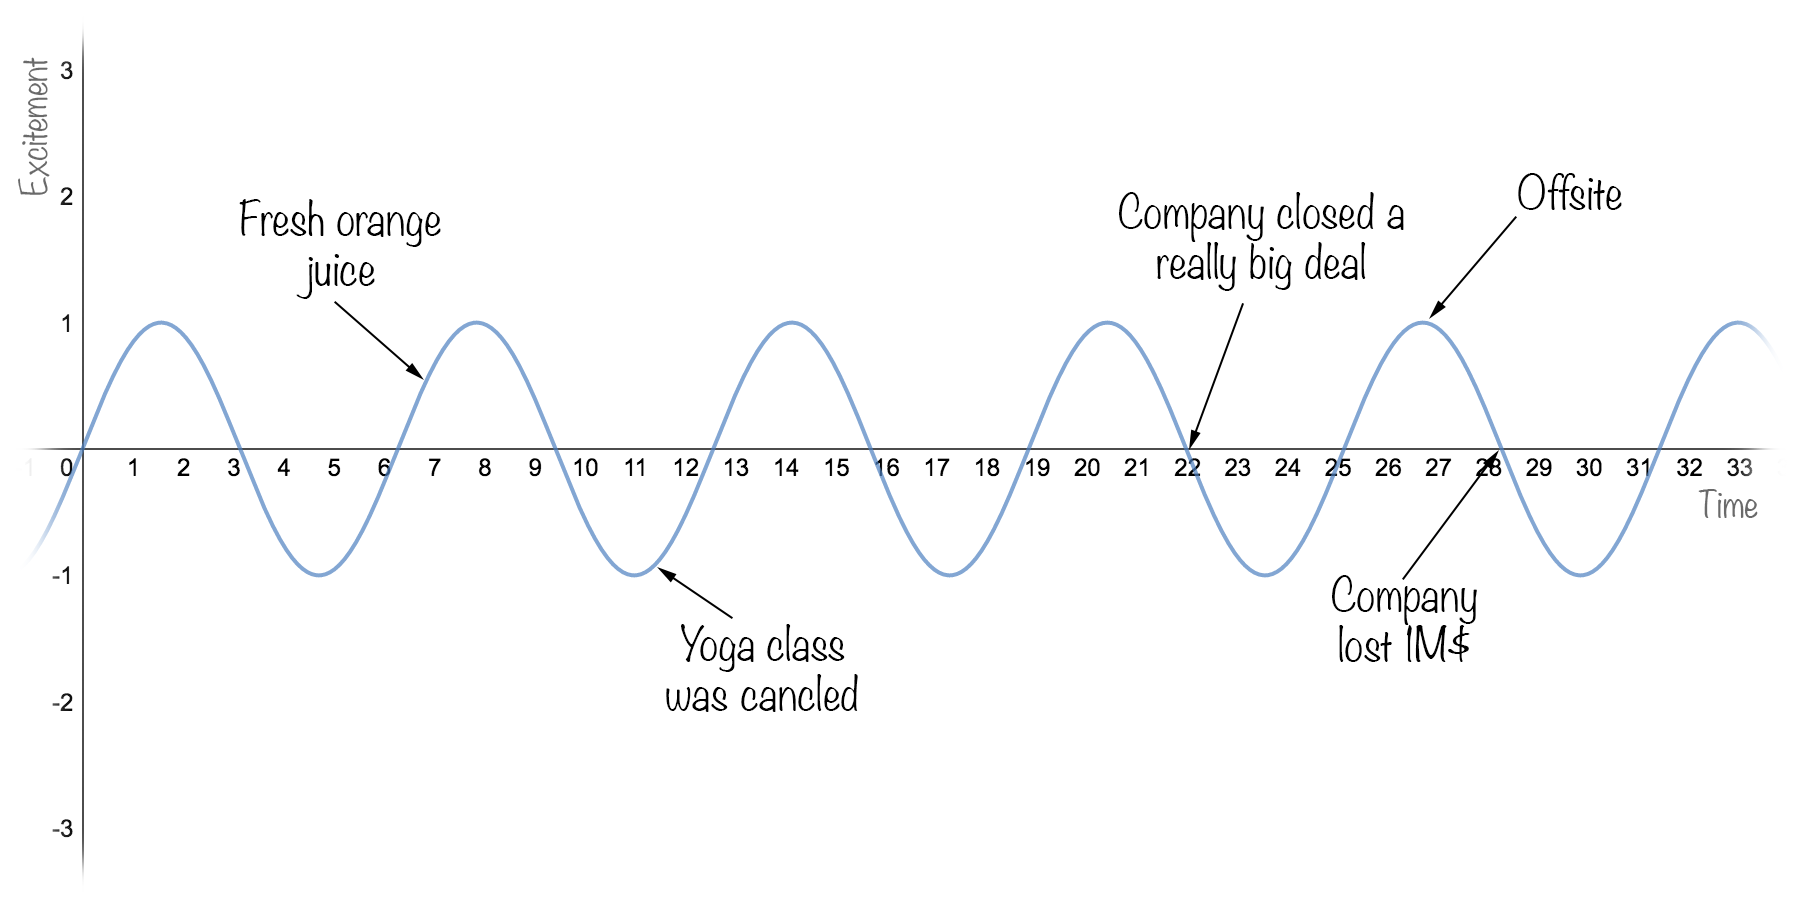
How excited are you when working in startup:
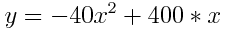
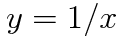
#Lines of code you write:
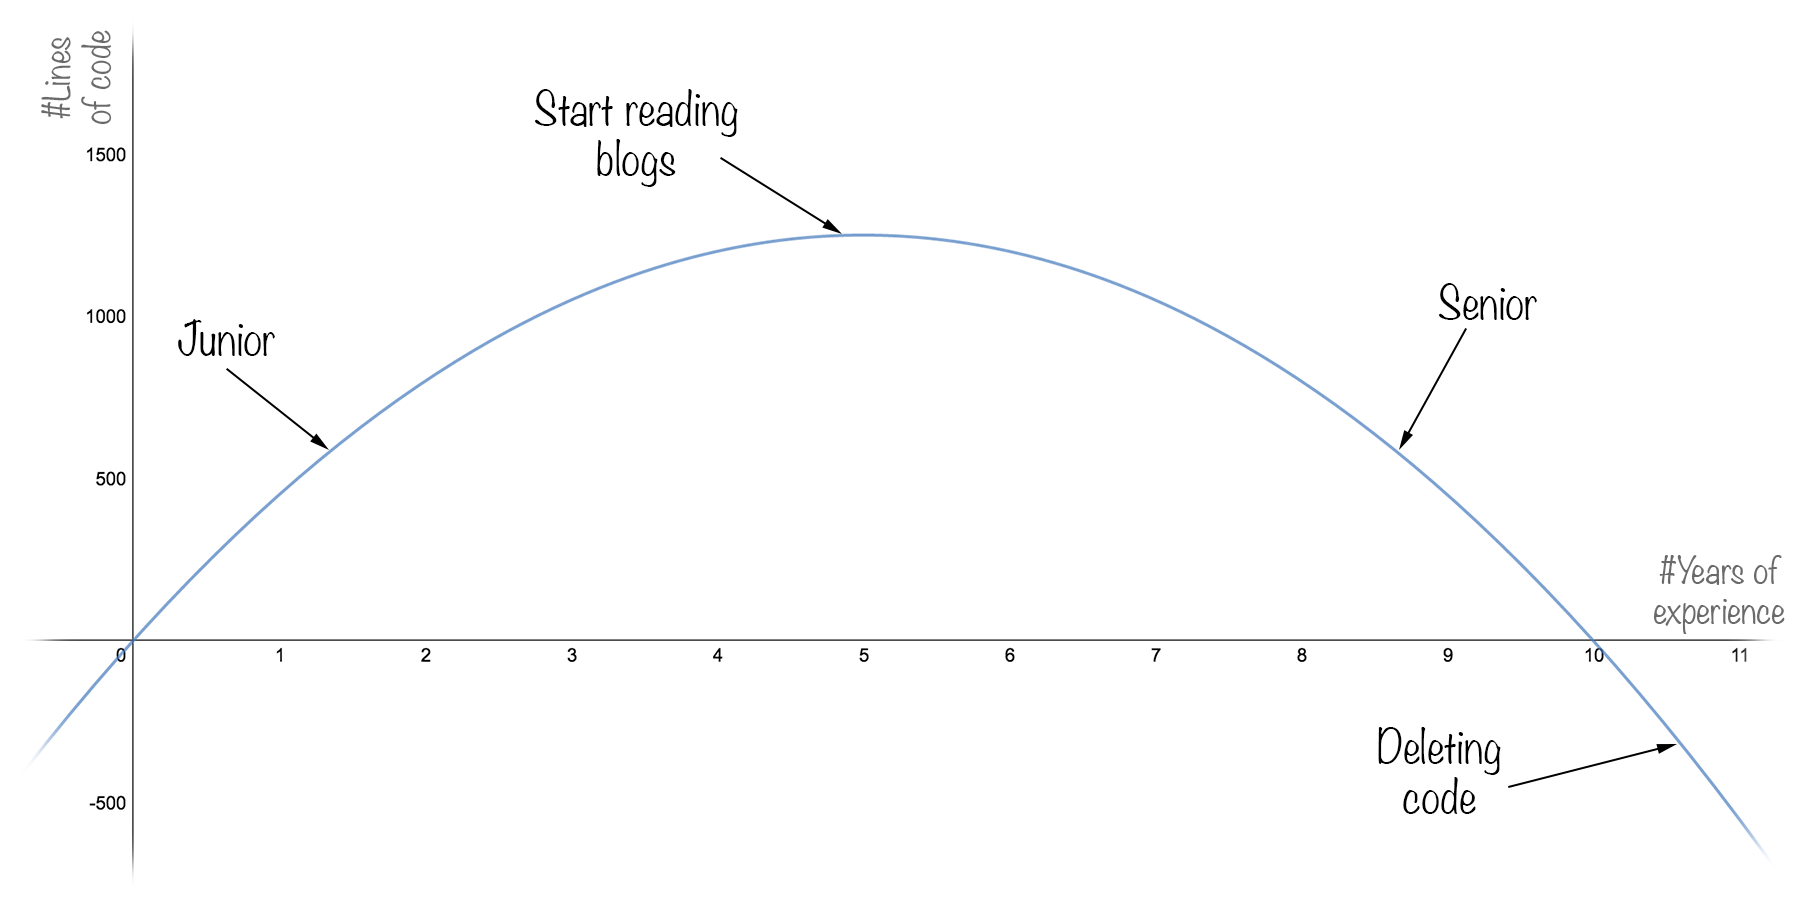
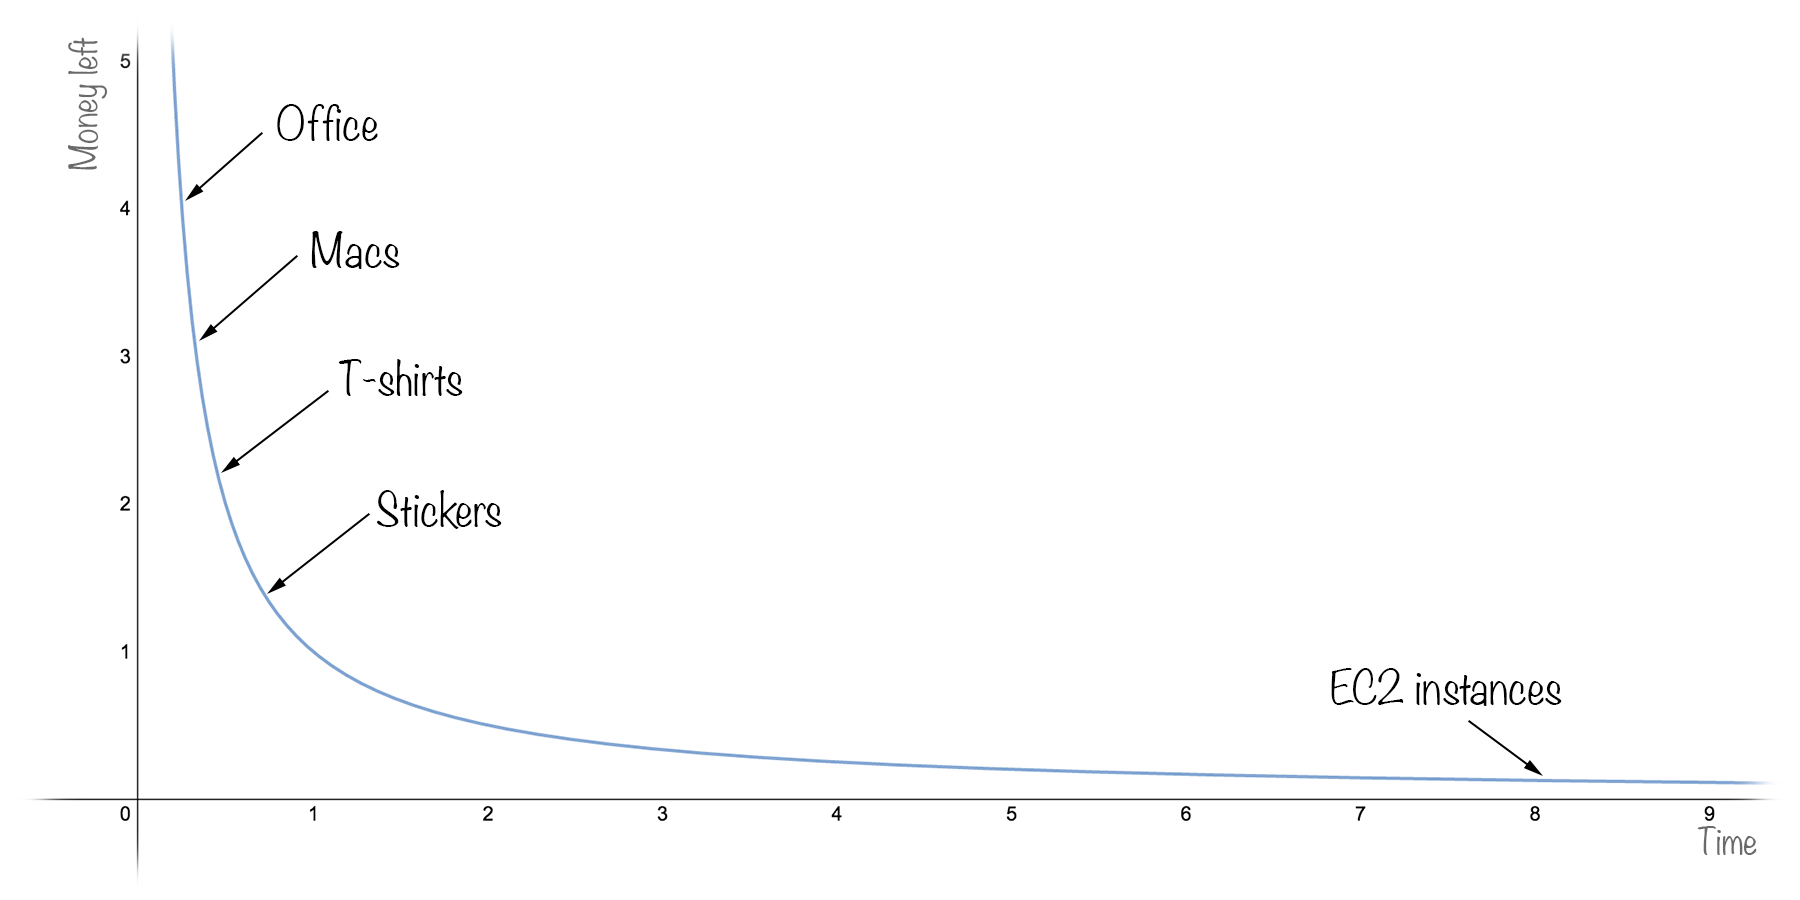
Startup burn rate:
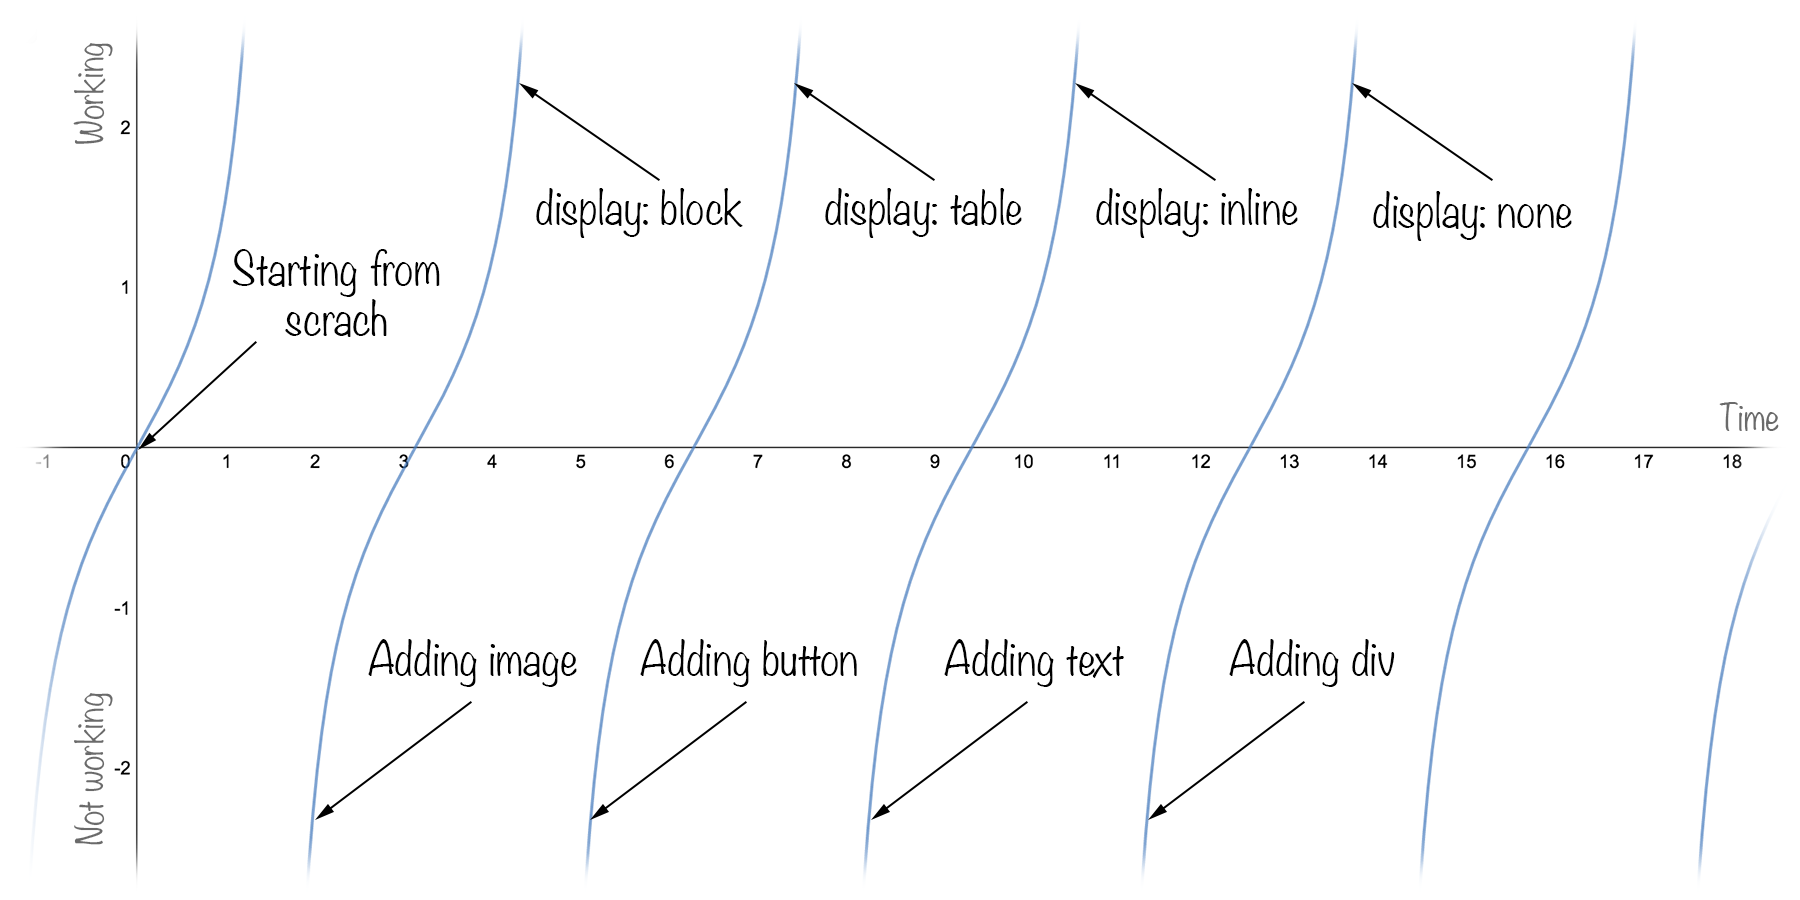
Do your css rules are working:
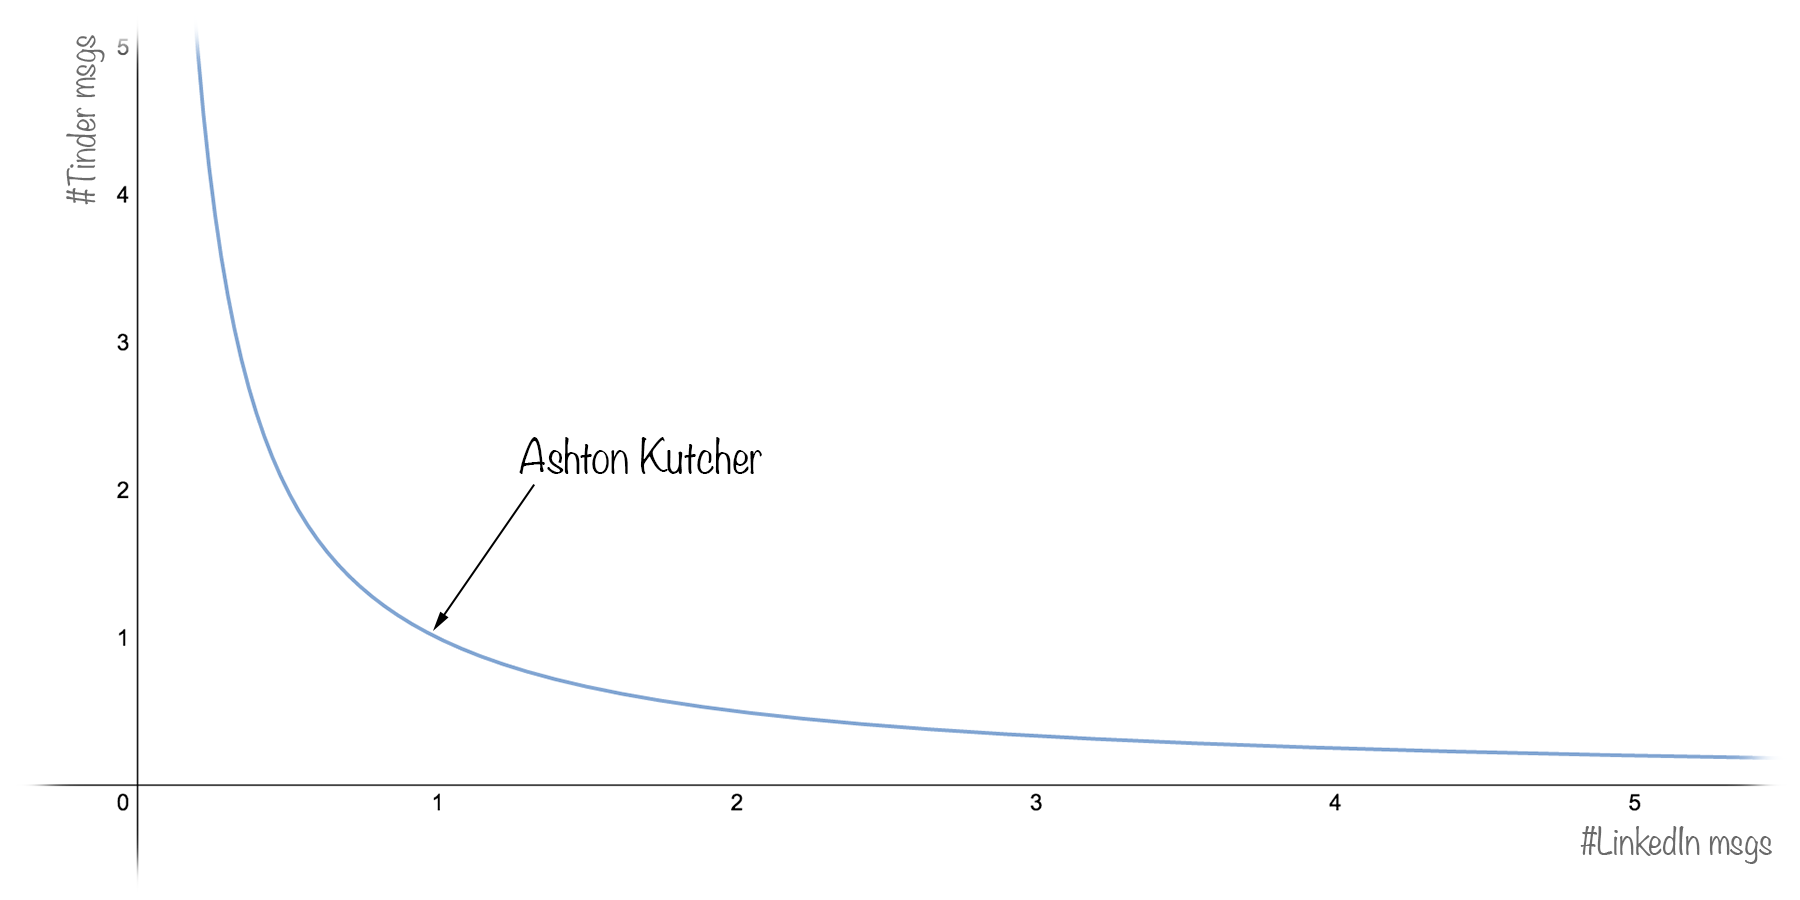
Number of messages you get from girls- LinkedIn / Tinder
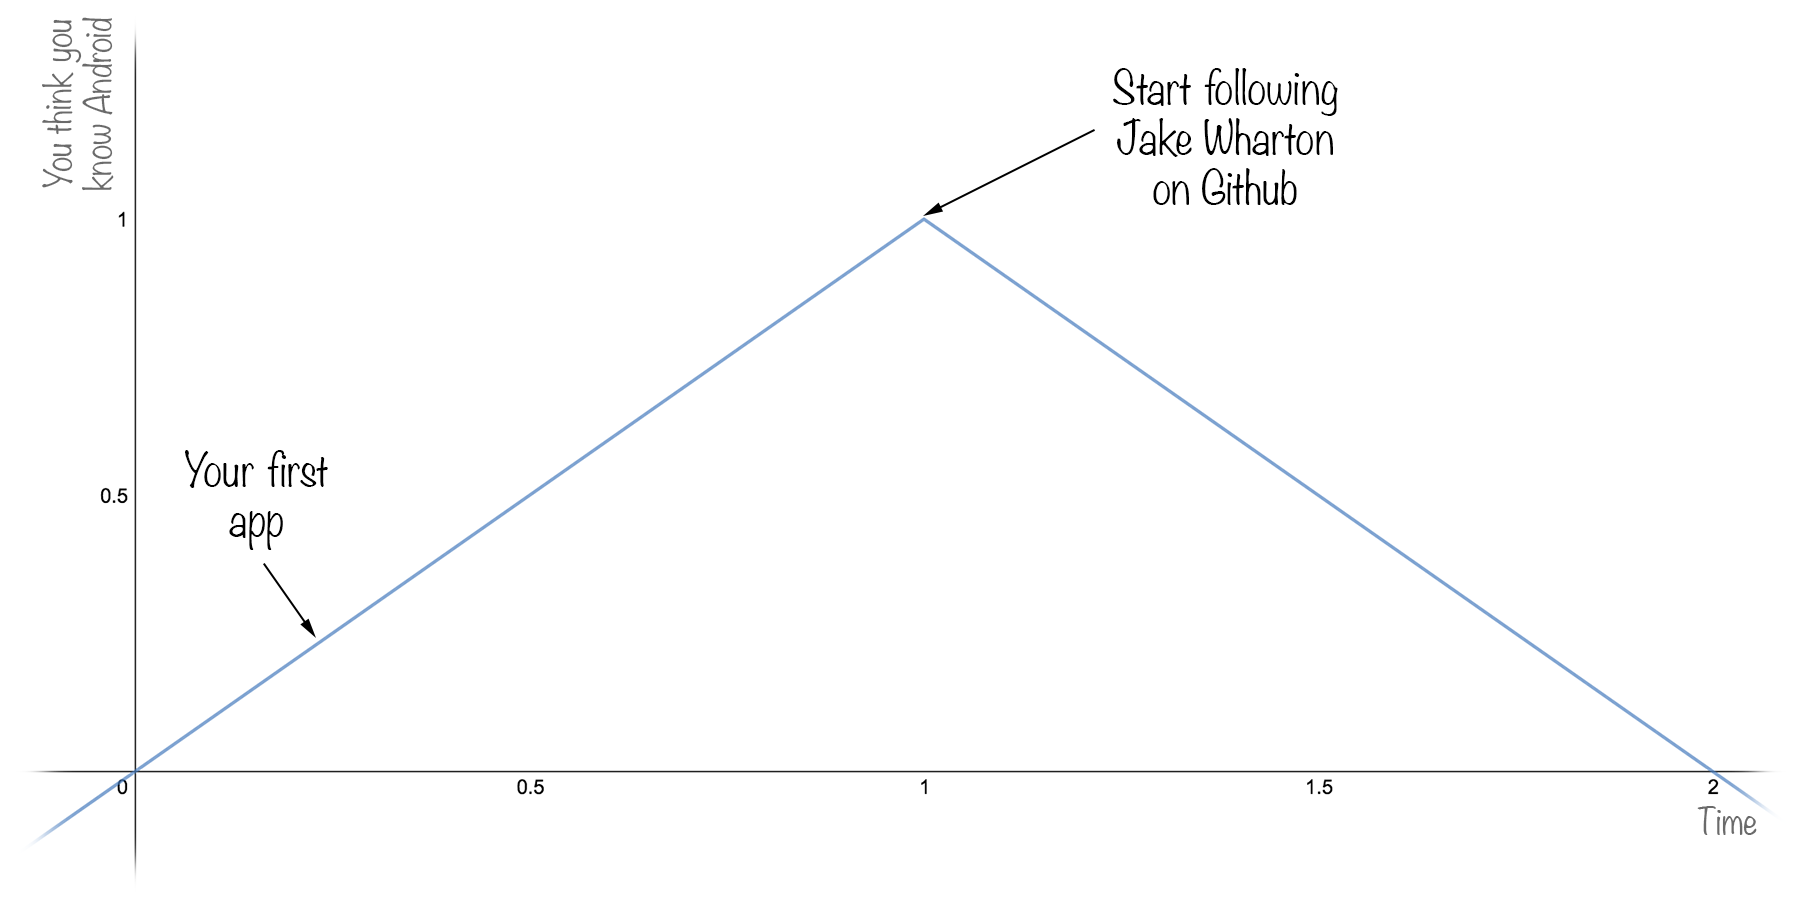
How much you think you know android:
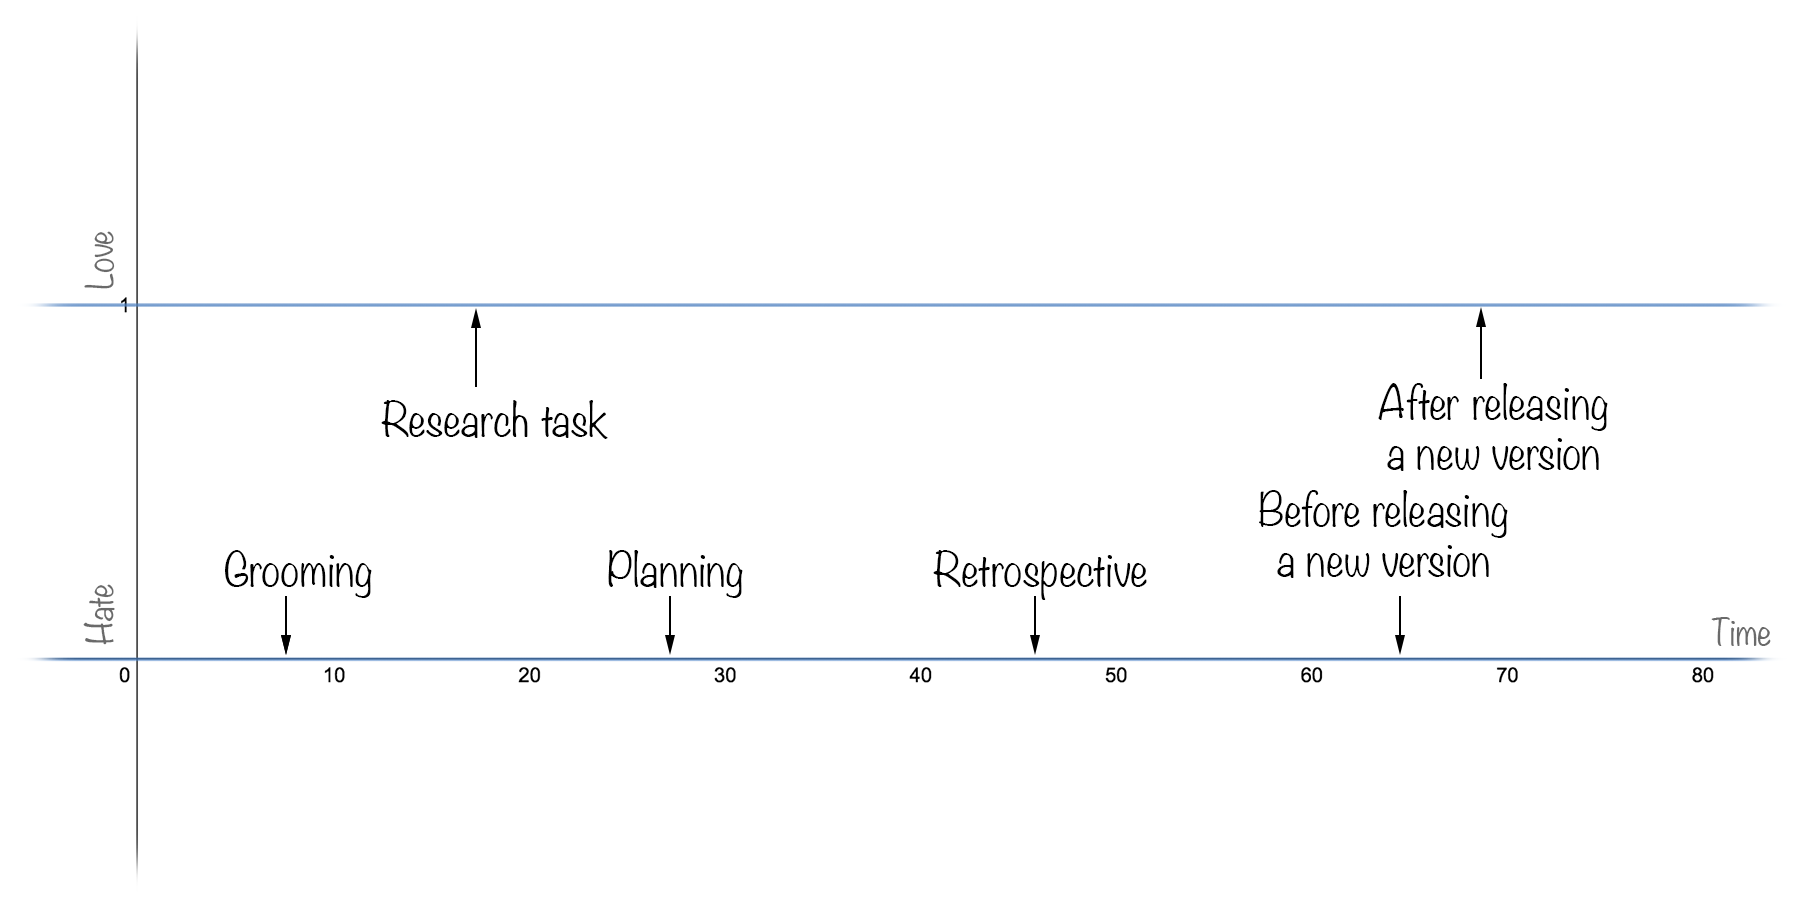
How much you like your PM:
Update: looks like people loving some of those graphs, so following couple of requests- you can now get it on shirts or stickers here.
If you enjoyed this post, please hit the “recommend” button below and share this story. I also love reading all comments. Thanks!